Portfolio
Relevant projects connecting my career path:
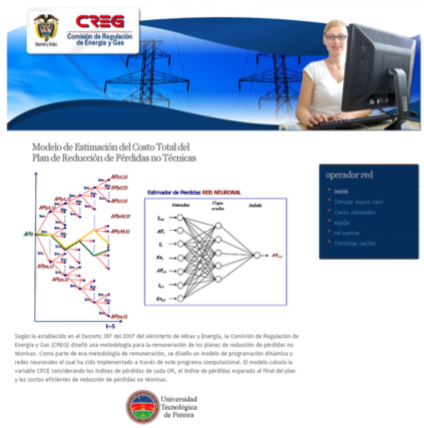
Web platform for electrical operators in Colombia (PHP, Drupal)
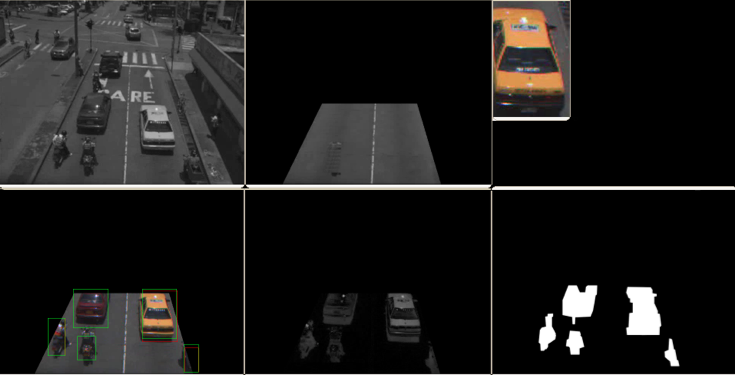
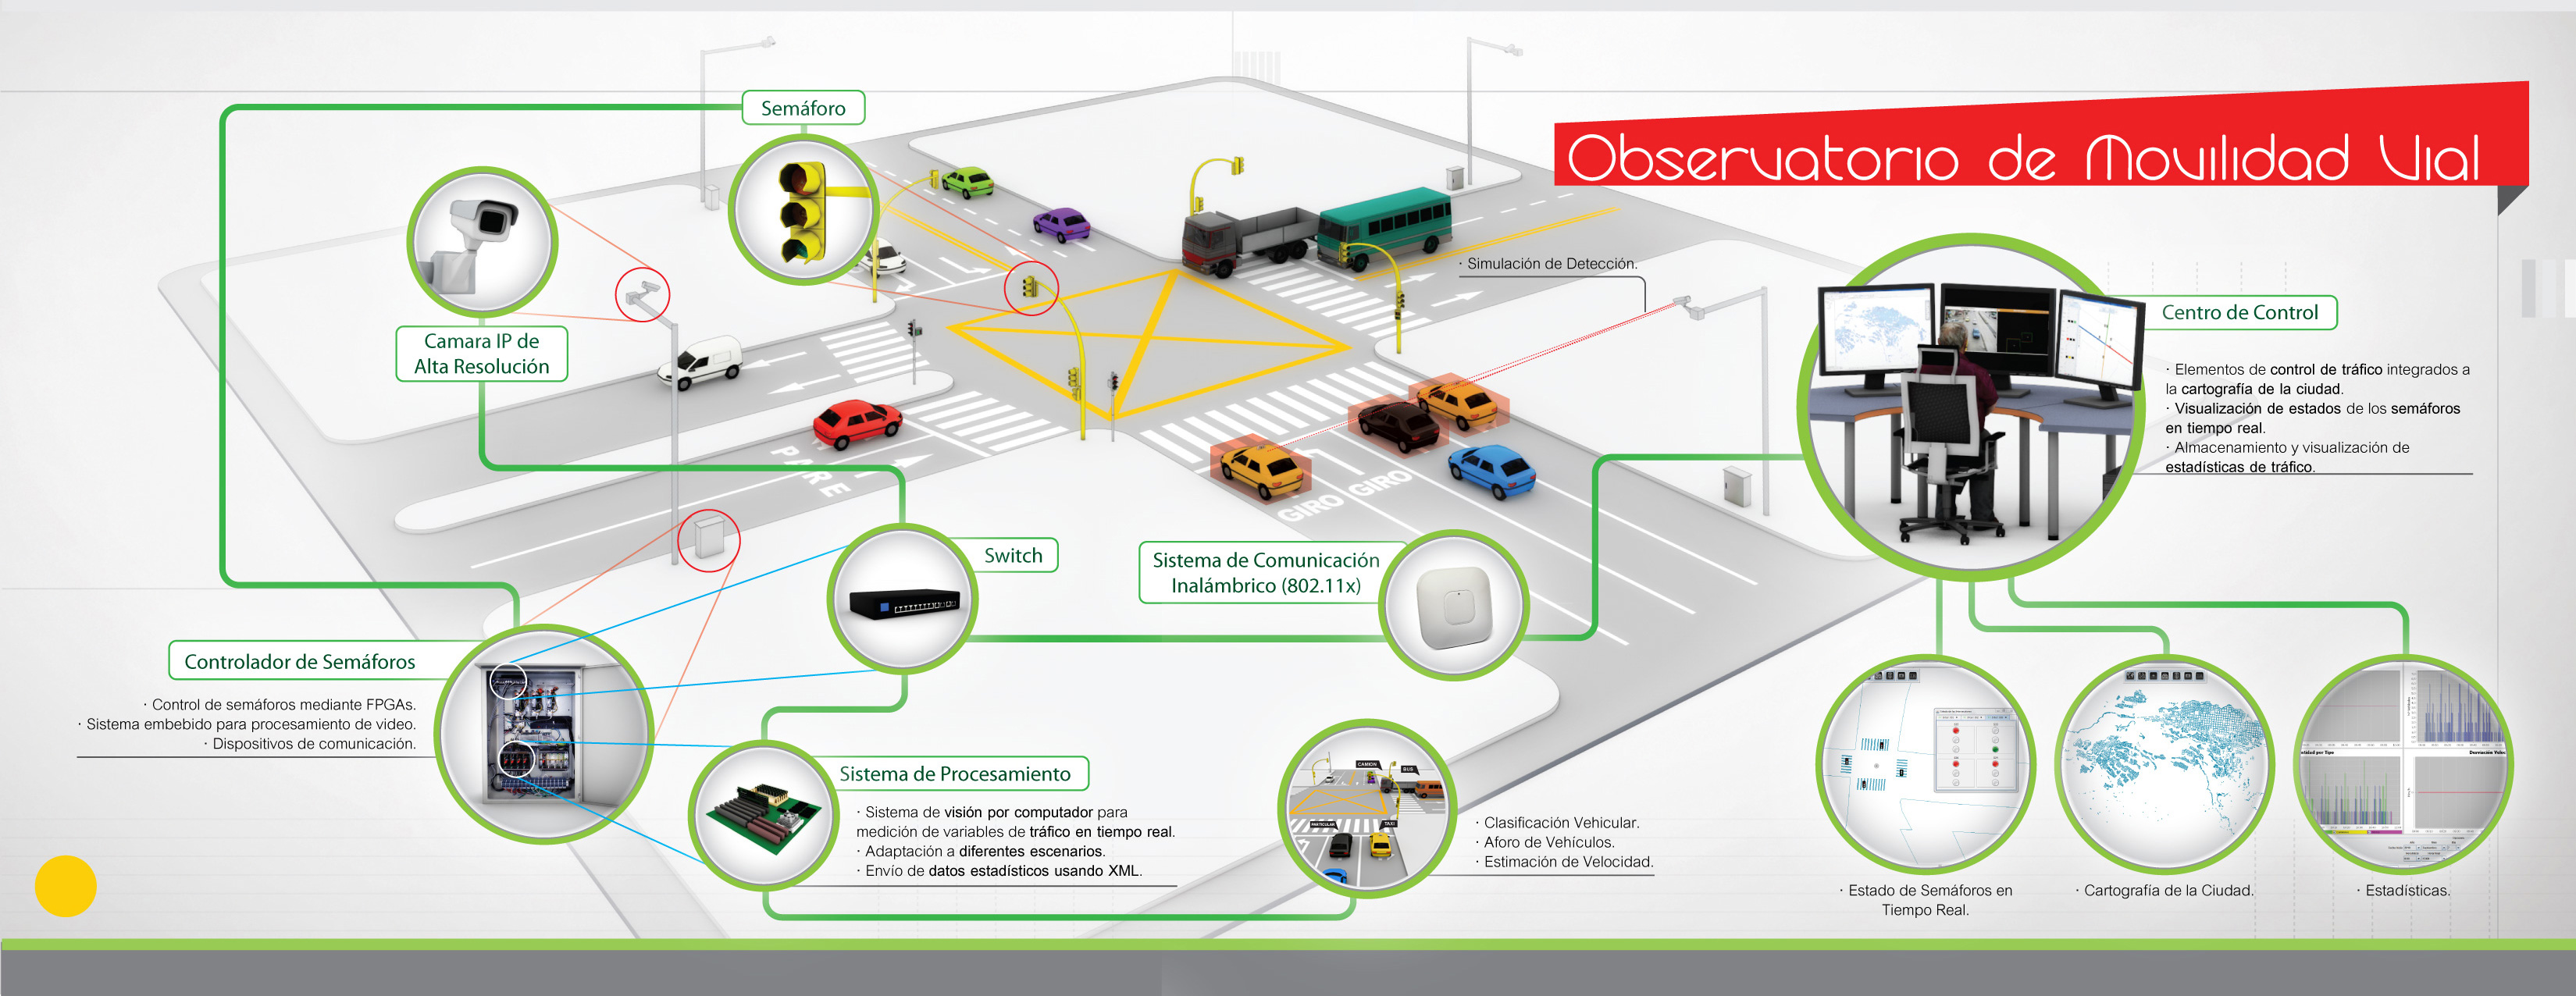
cvTraffic
We implemented a vehicle classifier using OpenCV (C).
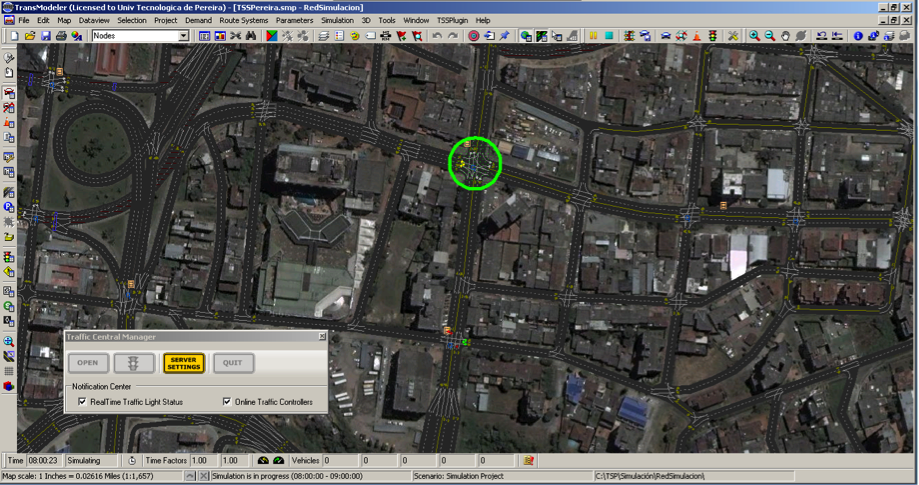
Microkernel app
Plugin for traffic light status visualization in TransModeler (C#)
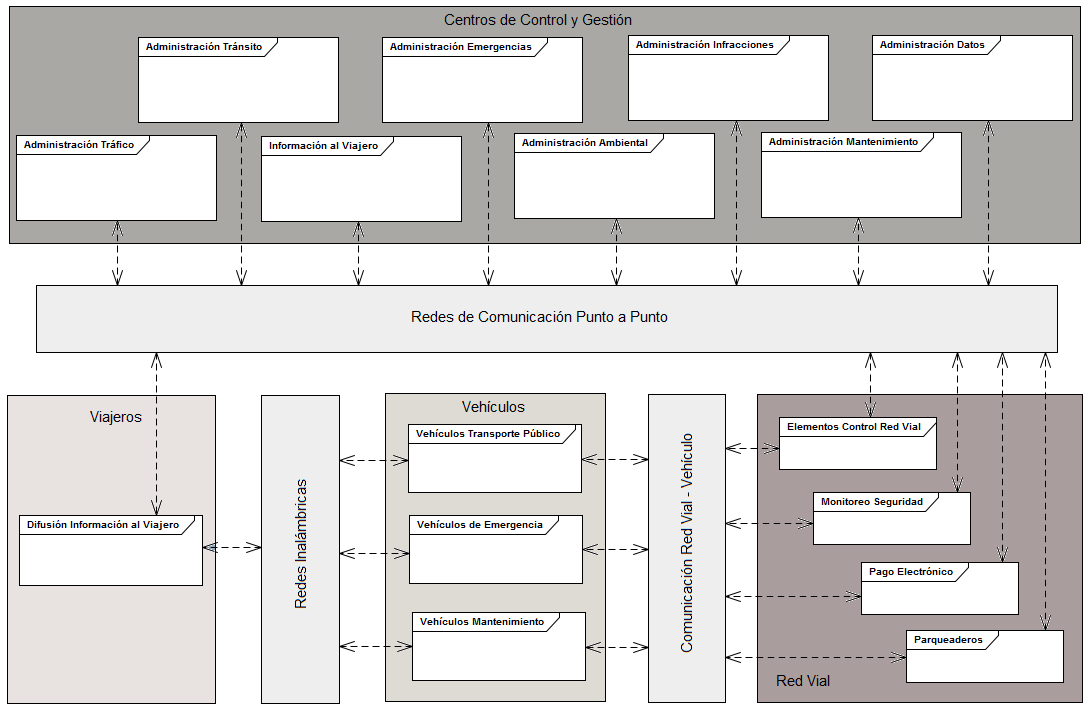
Intelligent Transportation Systems
I designed the West-Central Metropolitan Area ITS architecture.
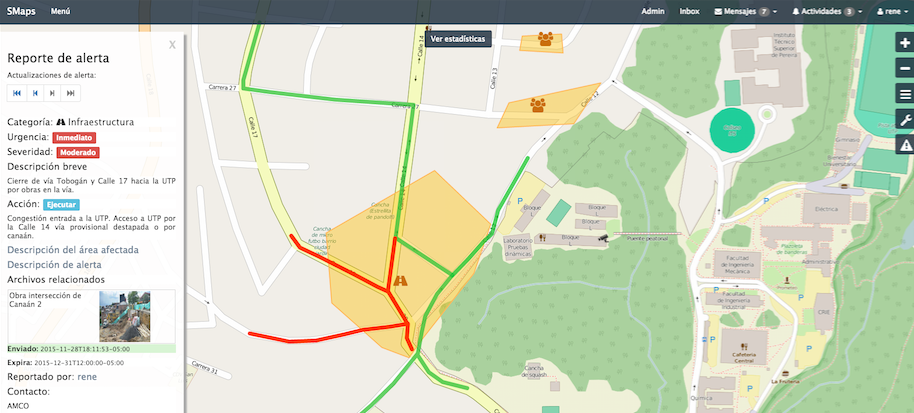
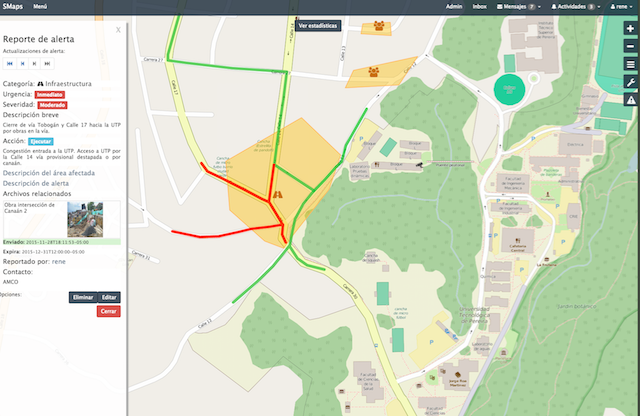
smaps
Web platform for Intelligent Transportation Systems.
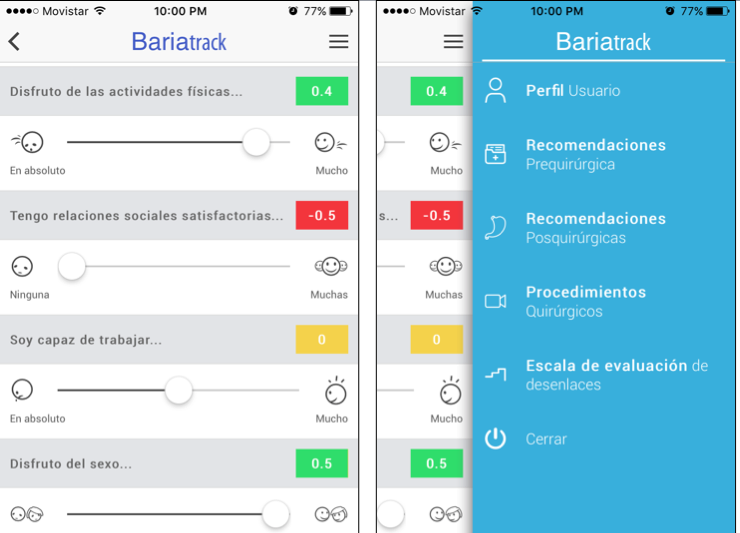
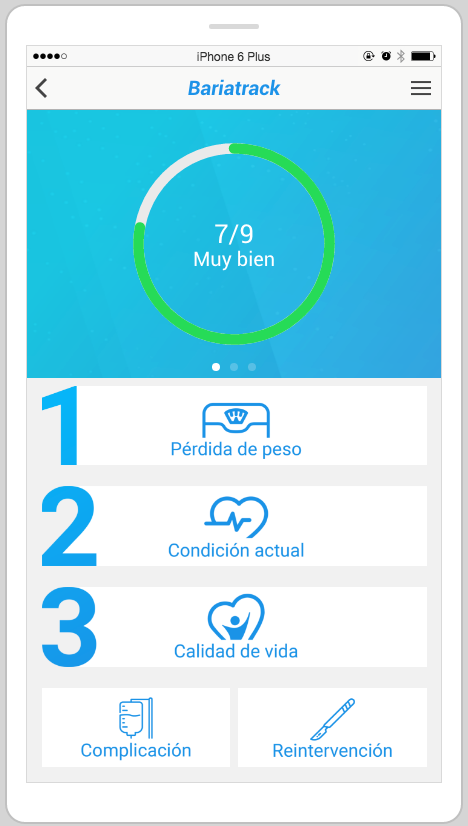
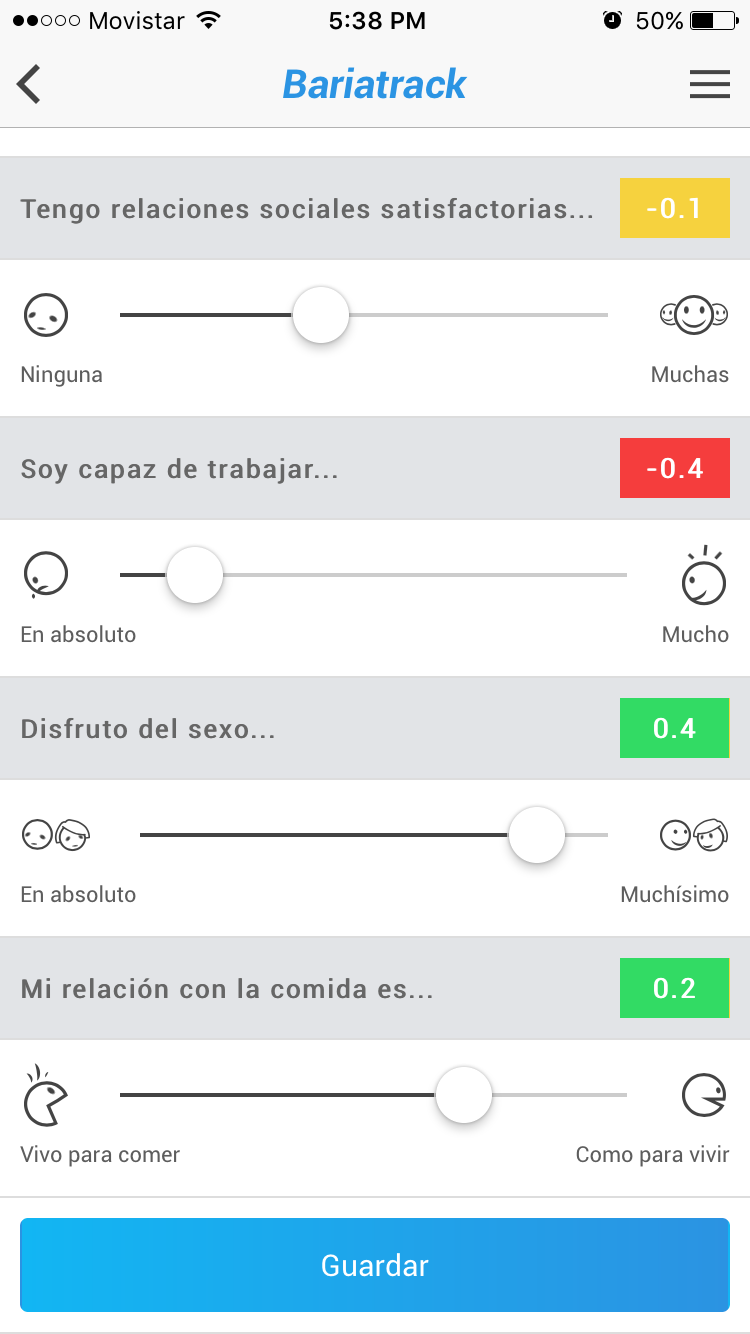
Bariatrack
Data modeling & collection. Mobile app using Ionic.
Centro Memoria
Colombian armed conflict dashboard.
Geo Tweets
Tweets visualization according to topic and geolocation.
UDAPTOR
Big Data startup business plan & prototype

Sentiment Analysis & Visual Analytics
Perception of Migration on social media
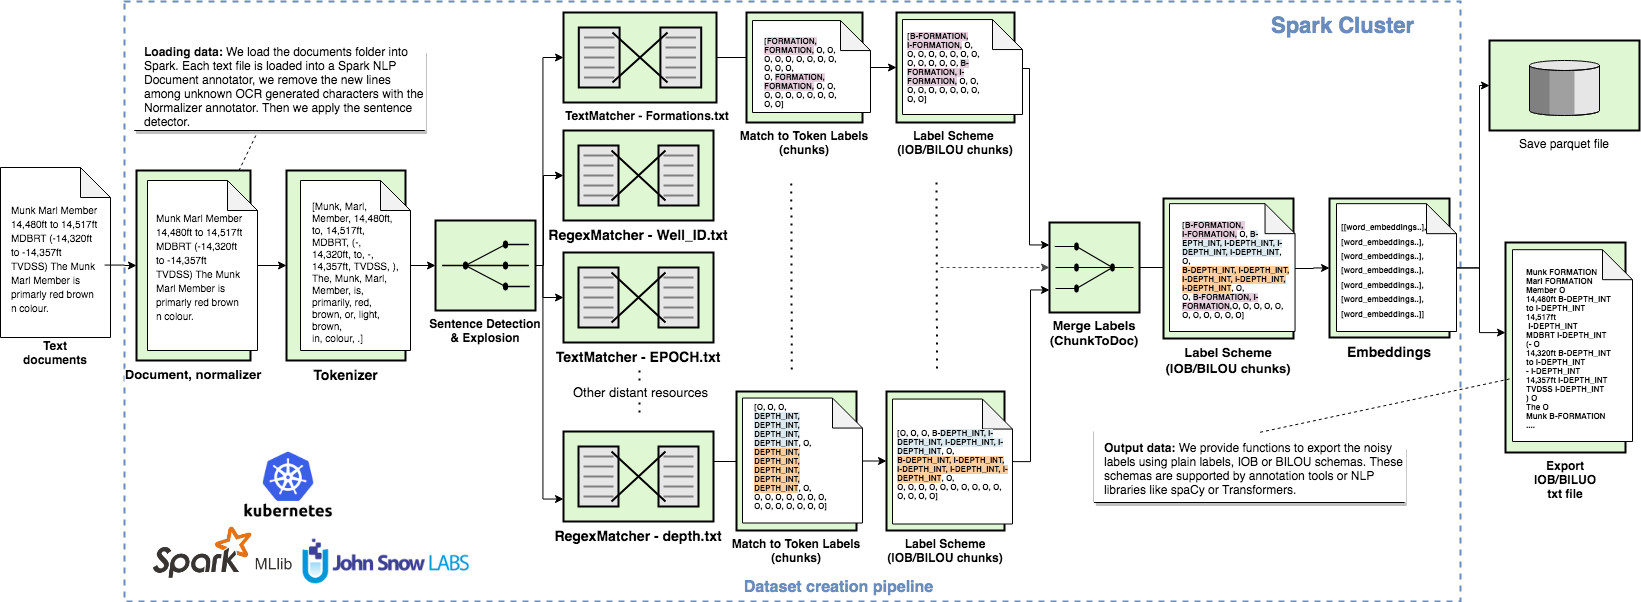
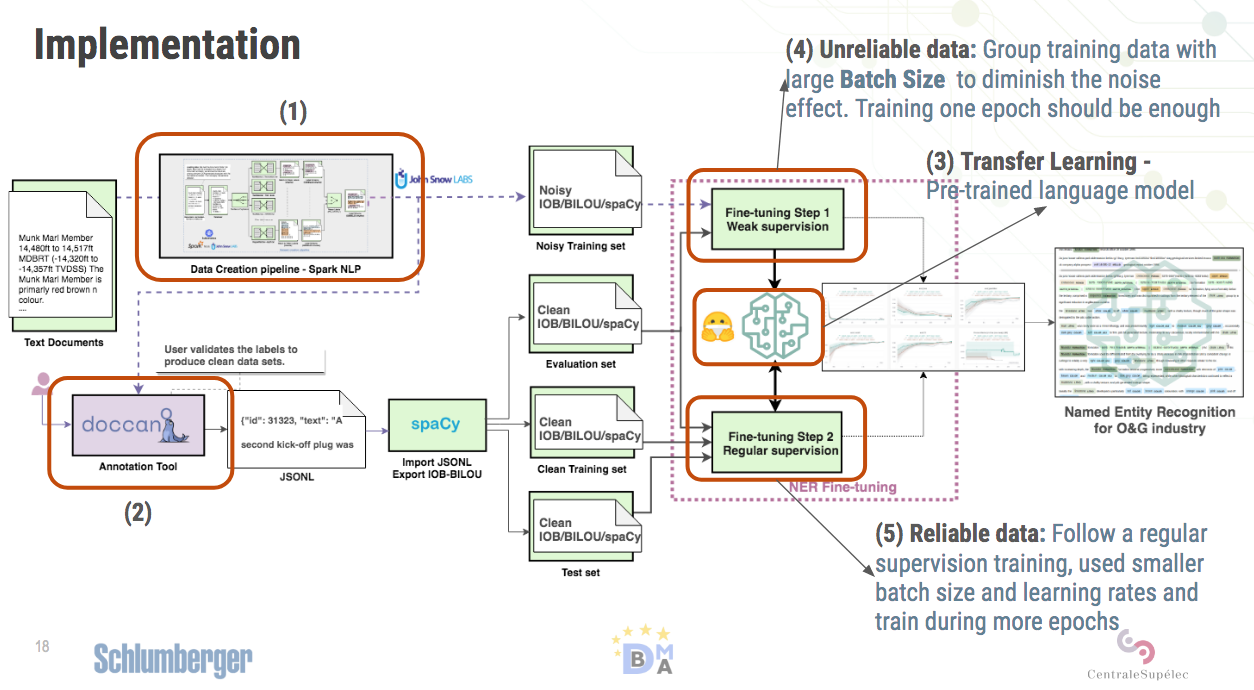
GeoBERT
Named Entity Recognition (NER) System for the Oil&Gas Industry